Visualise your data with ggplot2
By Abu Bakar Siddique, adapted from RaukR workshop at NBIS
Graphs to show data
Base R or ggplot2
ggplot2
• Consistent coding • Flexible • More complicated syntax for simple plots, easier for complex plots • Saved to object
Grammar of Graphics
Leland Wilkinson’s The Grammar of Graphics —> Hadley Wickham ggplot2 in 2005 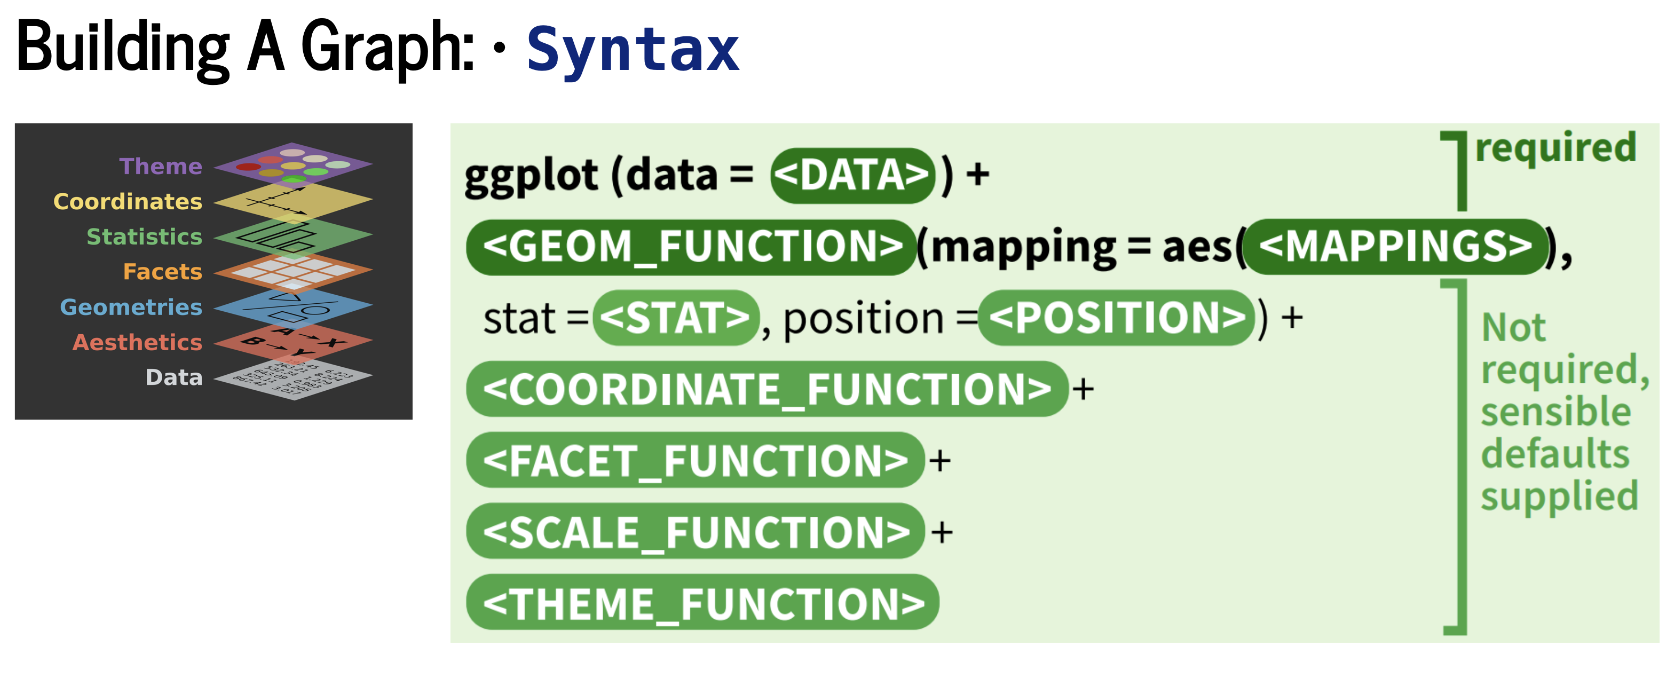
Plotting using functions:
• Data: input data always in data.frame format —> str() to get structure of data • Aesthetic: mapping or visual characteristics of the geometry • Geometries: geometry representing data - points, lines, … • Facets: split plot into subplot • Statistics: statistical transformation- counts, means, … • Coordinates: numeric system to determine position of geometry - cartesian, polar, … • Scale: how visual characteristics are converted to display values • Theme: citrons points of display - font size, background colour, …
Data formats
Wide data: every variable as separate column. Long data: all numeric variables are in one column, also called tidy data. —> column names into one column: variable —> values into values column
Plotting stats
Stats can be plotted using “geom” argument in stat function call. All stats have default geometries.
Aesthetics
Mapping: aesthetics mapped to variable Parameter: defined, set values
Scales
Control positions, colour, fill, size, shape, alpha, linetype Syntax: scale_
Facets
Split to subplot based on variable(s) Faceting in one dimension: facet_wrap(~variable) Two dimensions: facet_grid(variable_1 ~ variable_2) / facet_grid(var_1 + var_2)
Coordinate systems
Ex: Cartesian, map, polar
Theming
Modify non-data plot elements/appearance • Save an appearance for later reuse • ?theme —> theme_grey(), theme_bw() • Theme legend: control legend position theme(legend.
Other things about ggplot2
• Theme rect: element_rect() • Theme reuse newtheme = theme_bw() + theme(…) p + new theme • Saving plots Function ggsave() • Combining plots Patchwork package patchwork::wrap_plots(p, q) + plot_annotation(tag_levels = “a”)
Other things about R
sessionInfo() Lists dependencies, versions and useful information when publishing data.